


Performance Statistics
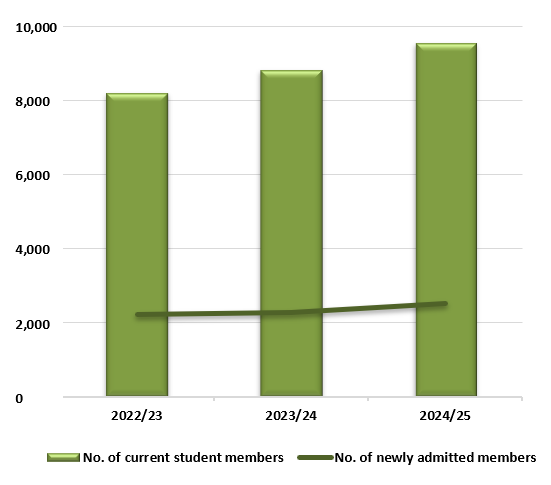
I. No. of newly admitted and current student members
Notes:
- Year mentioned above refers to school year
Summary notes:
The number of newly admitted members remains quite stable in 2024/25; while the figure for current student members exhibits a steady increase.
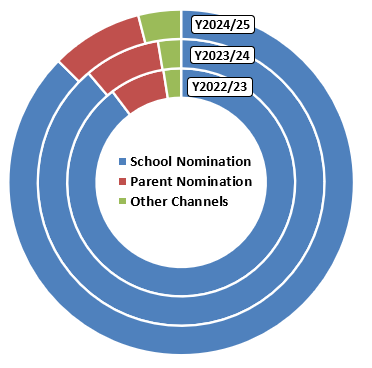
II. Distribution of nominees by nomination channels
Notes:
- Year mentioned above refers to school year
- "Self nomination" has been re-named as "Parent Nomination" starting from 2023/24
Summary notes:
There are three nomination channels, namely: (i) school nomination, (ii) parent nomination, and (iii) other channels (e.g. Nurturing the Gifted Scheme). The distribution pattern amongst various channels remains quite stable across years, and the majority of nomination is through school nomination.
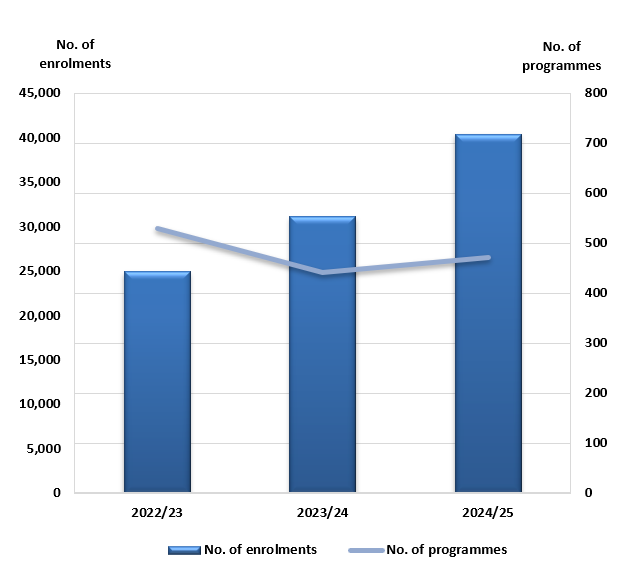
III. No. of enrolments and no. of programmes
Notes:
- Figures refer to all types of programmes (e.g. workshops, courses etc.); while re-run online learning programmes within a year are counted as one when compiling the total number of programmes in the year.
- Year mentioned above refers to school year
Summary notes:
The number of enrolments shows a steady increase across years; while the number of programmes remains quite stable in 2024/25.
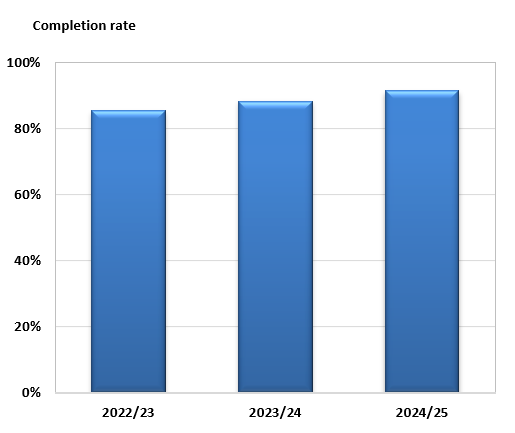
IV. Completion rate
Notes:
- Completion rate: (No. of completion / No. of enrolments) x 100%
- Figures exclude online learning programmes
- Year mentioned above refers to school year
Summary notes:
Completion rate remains stable across years, being around 85% or above.
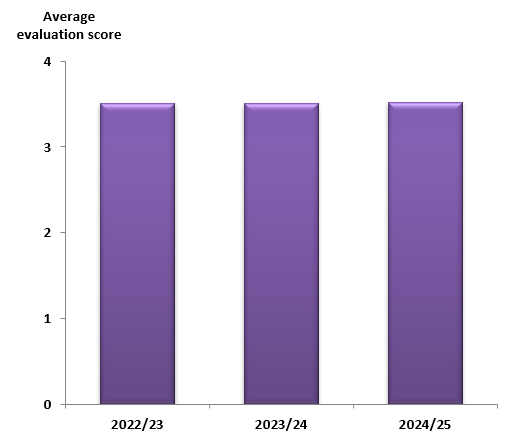
V. Average programme evaluation score (student feedback form)
Notes:
- Programme evaluation score: 4-point scale (max =4) adopted in Student Feedback Form
- Average programme evaluation score: taking average over evaluation score of each programme concerned
- Year mentioned above refers to school year
Summary notes:
Average programme evaluation score is stable and above 3.5 throughout the whole period.
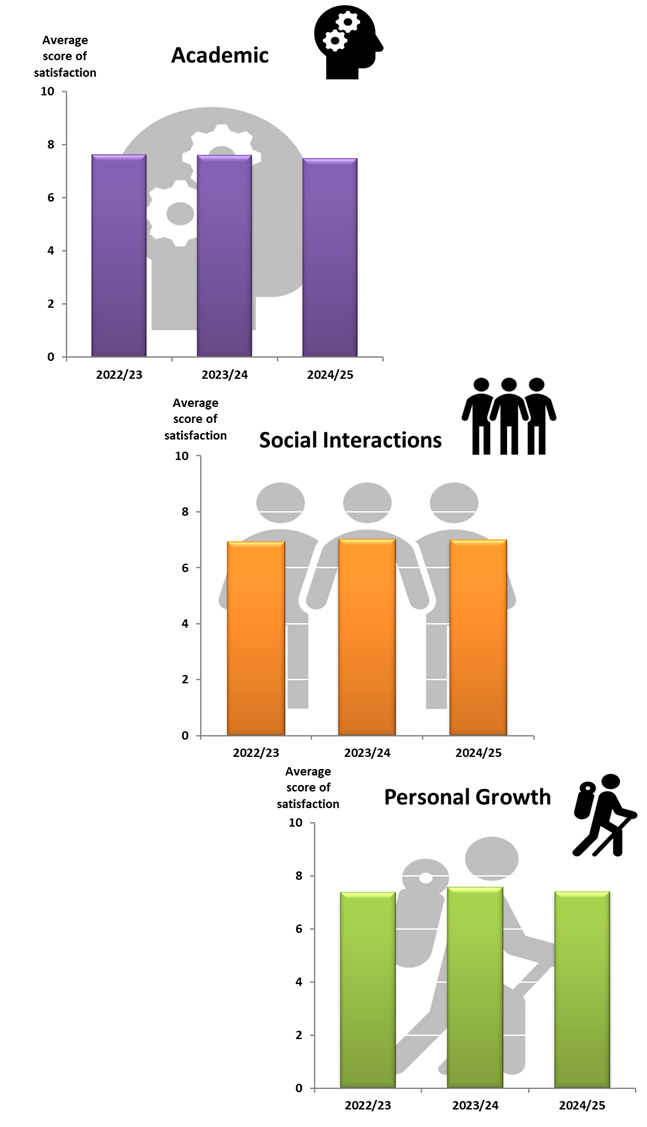
VI. Average score of satisfaction in various aspects
Notes:
- Figures before 2024/25 stem from the Annual Student Tracking Survey
- Figures in 2024/25 stem from the Graduate Student Member Survey
- 10-point scale (max =10) adopted
- Years mentioned above refers to school year
Summary notes:
Average scores of satisfaction with respect to the aspects of Academic, Social Interactions and Personal Growth are quite stable across years, being around 7 or above throughout the whole period.
Update Date:2026-06-01